DISASTER PREPAREDNESS NEW YORK CITY
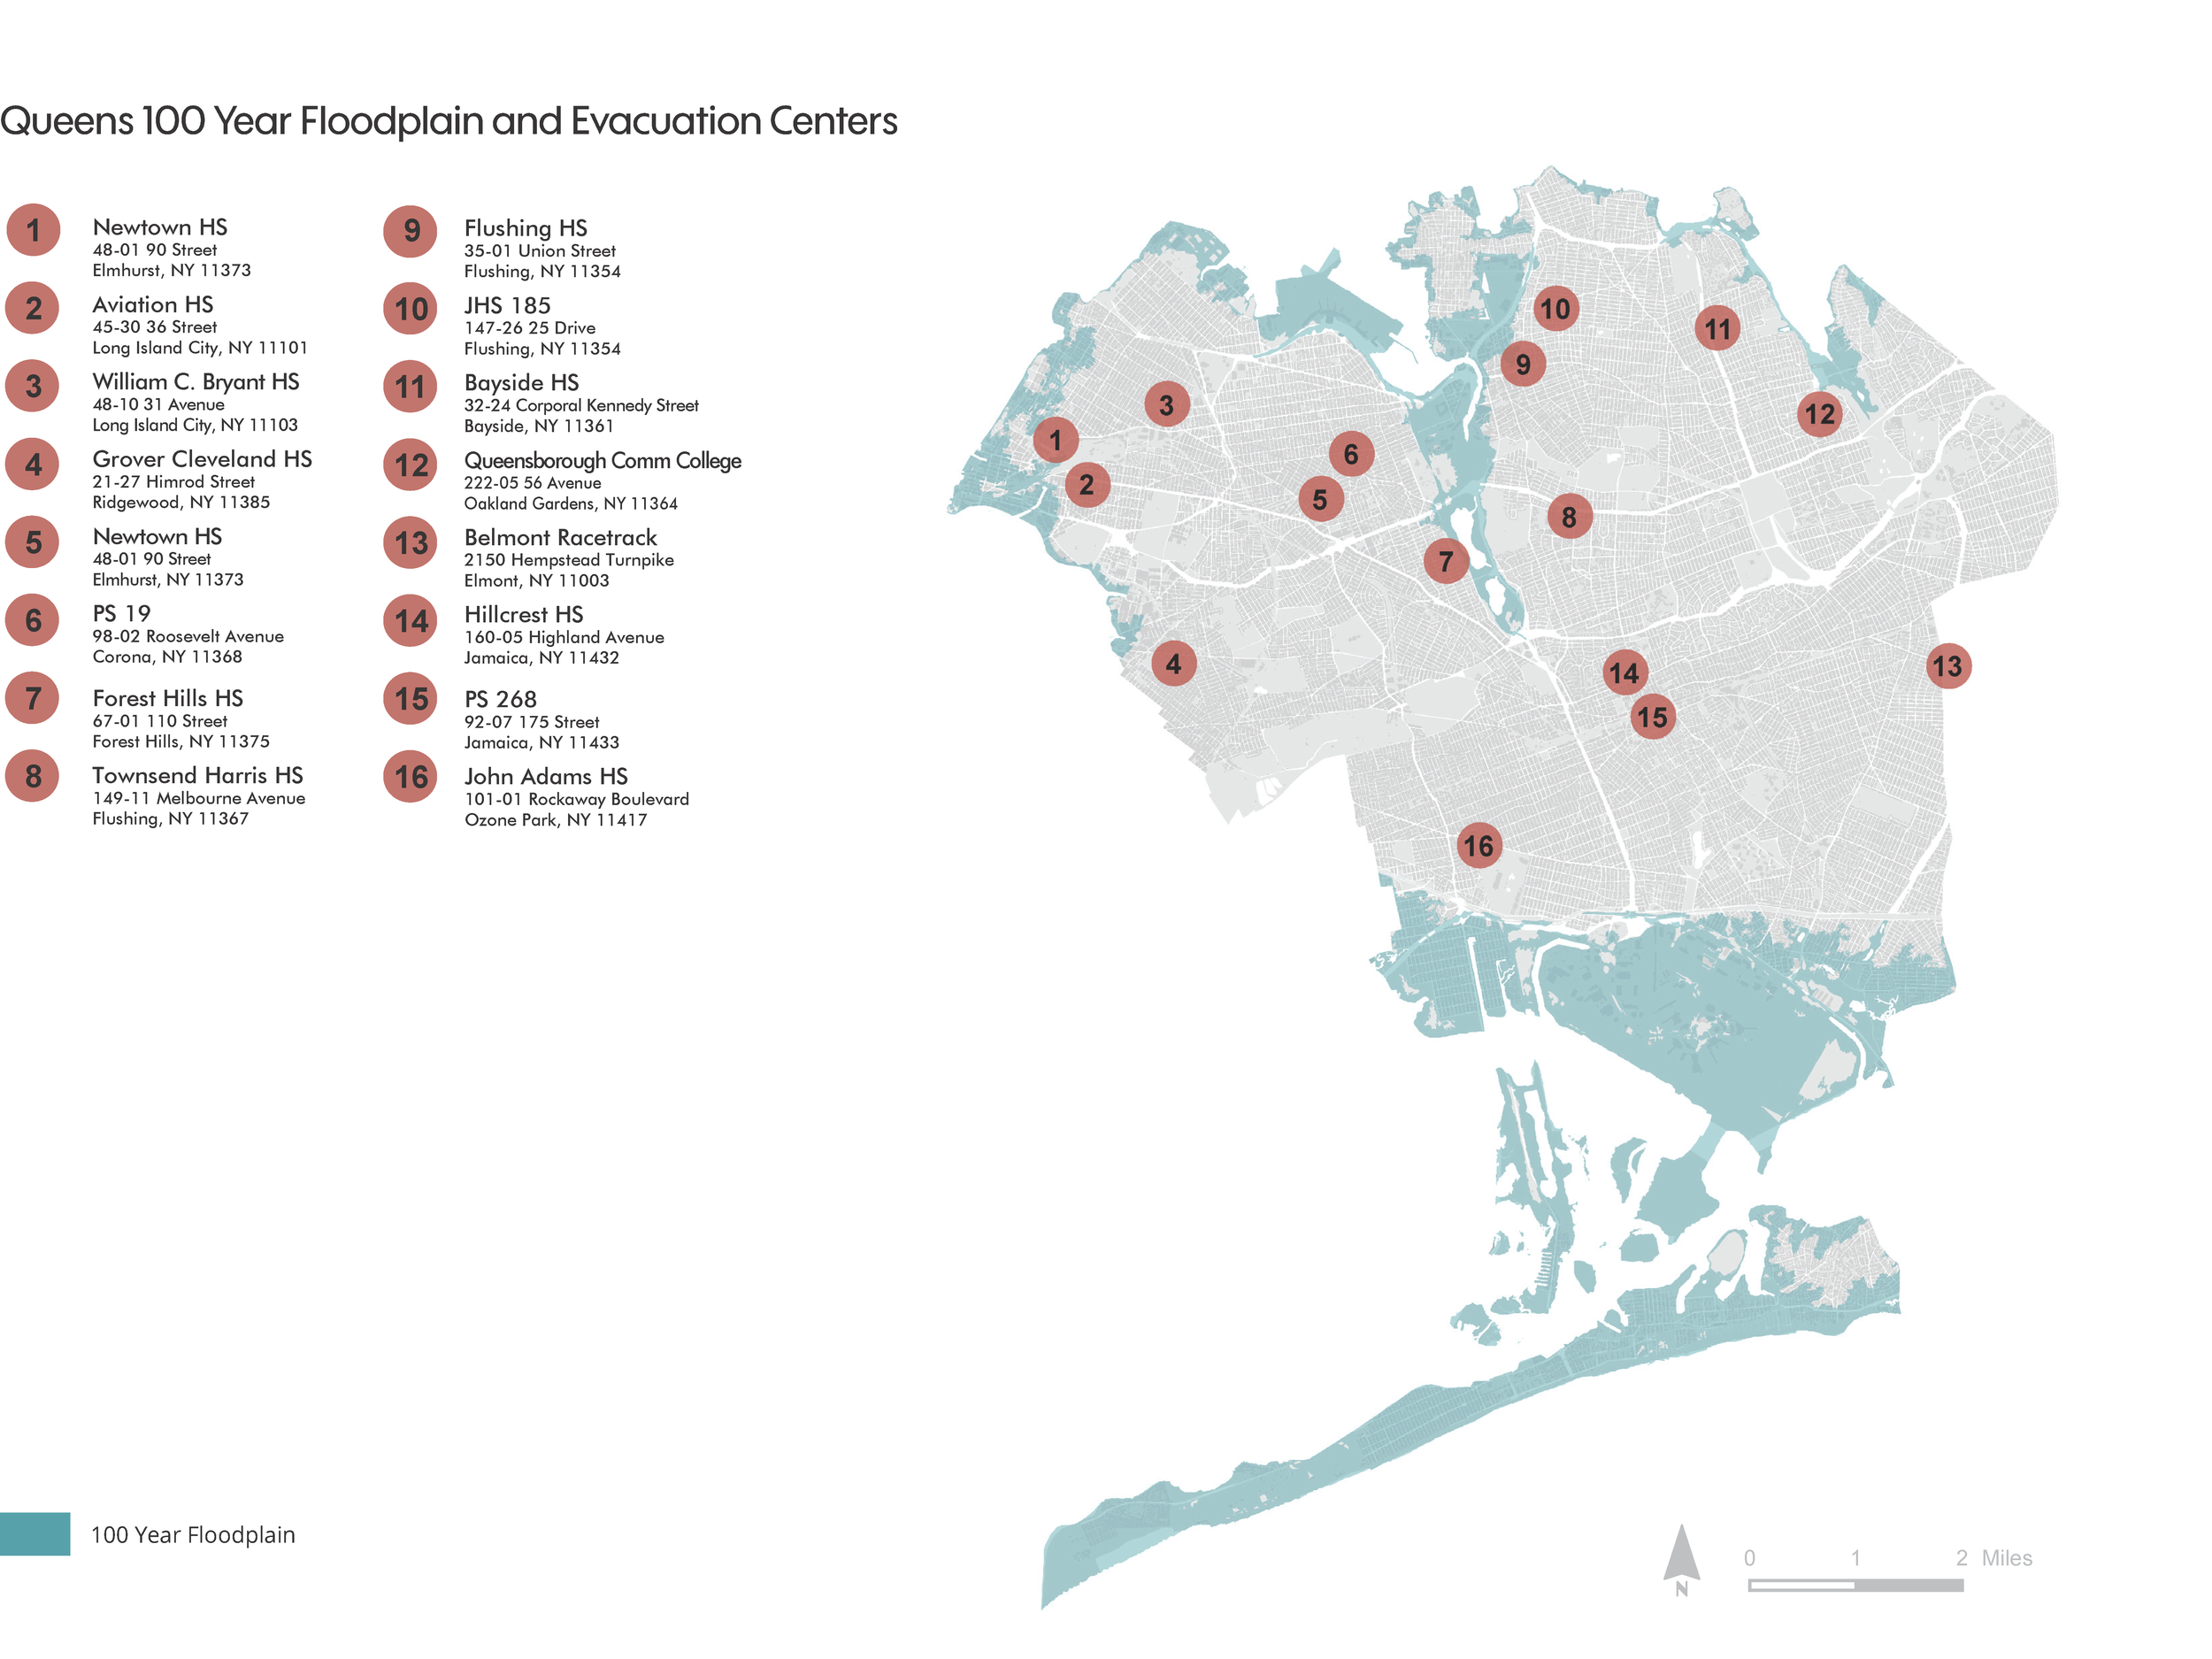
This collection of maps were featured in the book "Disaster Preparedness NYC: An Essential Guide to Communication, First Aid, Evacuation, Power, Water, Food, and More Before and After the Worst Happens" by Olivia Jovine. The maps provide essential disaster preparedness information, specifically regarding flooding and storm surge, highlighting evacuation zones and centers, FEMA's 100 year floodplain, and flooding from Superstorm Sandy in 2012.
// evacuation zones and centers by borough
These maps show the evacuation zones and evacuation centers for each borough. New York City has six levels of hurricane evacuation zones that are determined by the projected impact of storm surge; zone 1 being the areas that are at the highest risk for impact and zone 6 being the areas with the least risk of impact.


// 100 year floodplain and evacuation zones by borough
Flood zones are determined by FEMA and based on one hundred years of flood information and flood calculations. These maps couple the FEMA 100 Year Flood data with local evacuation centers for each borough to better assist residents in case of a flood related disaster.


// superstorm sandy flooding and 100 year floodplain in select neighborhoods
The neighborhoods of Hunts Point, Bronx; Red Hook, Brooklyn; and Midland Beach, Staten Island were featured in the book as high risk areas to storm surge. These maps compare the flood damage caused by Super Storm Sandy in 2012 to FEMA's updated 100 year floodplain. Aside from a small portion of Midland Beach, most of the flooding occurred within the floodplain. In the case of Hunts Point, inundation from Super Storm Sandy was minor; however, as indicated by the FEMA 100 Year Floodplain, the potential for flood related damage is high. Future storms pose a threat to the neighborhood and the Hunts Point Food Distribution Center.
Sources: NYC Department of City Planning, NYC Office of Emergency Management, FEMA


